
Hoverview is a series of blog posts throughout the ICAERUS project discussing everything drone technologies. This fourth instalment presents practical pitfalls and a holistic way to think about drone analytics. It is part of an online Workshop especially developed for the Open Call Trials, feedback and findings from that workshop were considered and added.
When developing a UAV application, one often encounters shiny new toys: drones with better sensors, longer flight-times, all-encompassing software packages, deep learning libraries with all the papers. All these toys seem better than before and from a quick glance seem like the one solution you have been thinking about. However, this is usually not the case, due to small details in the UAV data processing pipeline, which deals with real-world, complex and often, living systems. This post and corresponding workshop aim to get to fundamentals in UAV data processing. And from these fundamentals, make a better selection of what to expect from shiny toys, and perhaps why the simple, well understood path might be better for you in the end.
The drone processing pipeline can be thought of as a simple flow: from what the sensors collect to the required end-results. This flow has four main steps: Flights, Data, Models, Information. Each step has its own problems to solve, and they all affect each other. Getting good results means understanding how these steps work together. This post will look at each step closely, showing how choices made early on affect everything that comes after in a drone project.
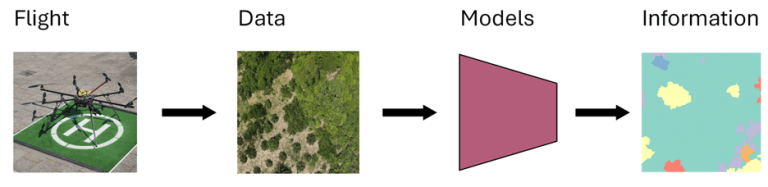
Figure 1. The UAV-analytics process
Flight
The flight phase represents the critical intersection between human expertise and technological capability, where theoretical planning meets real-world execution.
Fundamentally, this phase emphasizes a physical presence in the field, engaging directly with the subject of investigation. You are not merely collecting data but are observing, documenting, identifying, and making real-time decisions that will impact the entire downstream workflow. This fieldwork establishes the crucial connection between the digital data you’re capturing and the phenomena you seek to understand and quantify through UAV-based analysis.
This encompasses understanding the fundamental characteristics of your data sources – whether you’re working with RGB cameras, multi/hyperspectral sensors, LiDAR systems, or thermal imaging devices or something completely different. Each sensor type brings unique dynamics: spectral sensitivity ranges, temporal resolution constraints, and environmental dependencies that directly influence data quality and interpretability.
The flying platform itself – whether a fixed-wing aircraft for large area coverage, a multirotor for precision work, or a specialized VTOL system – determines your operational envelope. Flight parameters become crucial considerations: altitude selections that balance ground sample distance with coverage and overlap percentages.
Data
The data phase involves, for many users, the somewhat boring, organization and management of the items captured during your flight. This covers the technical specifications of file formats – understanding the differences between RAW sensor outputs, compressed formats, and their implications for downstream processing accuracy. Each sensor generates data in specific formats: high-resolution TIFF files from cameras, LAS point clouds from LiDAR systems, or specialized formats from hyperspectral sensors.
Filename conventions and folder structures serve as the metadata backbone of your data management system. Developing systematic naming protocols that embed essential information – timestamp data, sensor identifiers, flight parameters, and processing status indicators. For example, imagine processing agricultural data from multiple fields over several months. Without proper naming like “Field_A_20240315_RGB_processed.tiff”, you might accidentally use May data when analysing March crop growth, or mix up processed and raw files, leading to completely wrong conclusions about yield predictions.
Models
Models represent computational engines that transform raw sensor data into meaningful analytical products. These are the input-output systems that combine algorithms, mathematical transformations, and statistical methods to extract information from your collected data.
The key considerations should be: What exactly do you need as output? A simple classification (healthy vs diseased crops), precise measurements (tree height to the centimeter), or probability maps (fire risk across a landscape)? Your output requirements should drive your model choice, not the other way around.
A basic threshold-based classifier might give you 85% accuracy in 10 minutes, while a complex neural network might reach 87% accuracy after days of training. For many applications, that 2% improvement isn’t worth the additional complexity, maintenance burden, and computational cost. Sometimes the simple, well-understood path delivers better value than the shiny new approach.
Information
Information represents the ultimate objective of the entire UAV workflow – transforming raw sensor measurements into actionable intelligence about your subject of study. This final phase encompasses the creation of accurate, documented, and contextual meaningful products that serve your analytical objectives and communicate findings effectively to stakeholders.
Now this seems straightforward: we fly over the subject, plop the acquired data in the computer and then we have our information. Sadly, for most of you, this is not the case. These phases are not linear at all! They are not even one-directional… Wrong decisions made in Flight phase might only come to light in the end of the process, and you get to restart all over again.
Consider the difference between delivering a complex GIS file with 47 different layers versus a simple dashboard showing “Field Section 3 needs irrigation in 2 days.” Both contain the same underlying information, but only one drives action. Your information products need to match how your audience thinks and works, not how your algorithms process data.
Documentation becomes crucial here – not just technical metadata, but the story of your analysis. What assumptions were made? What are the confidence levels? Under what conditions might these results be wrong? A forest health assessment that doesn’t mention it was conducted during drought conditions, or a infrastructure inspection that omits weather effects during data collection, can lead to seriously flawed decision-making.
The Holistic Approach
Let’s take the example of processing your raw imagery data into an orthomosaic (a high-resolution map of the subject): Models (algorithmic input-output) boxes are calculating image pairs, and triangulate distances, to stitch these images together with ORB-matchers and transformations, to come to a new data format: the orthomosaic. The orthomosaic is often the starting map for further analysis on spatial correlations and the like. Furthermore, the quality of your orthomosaic is highly dependent on flight settings such as image overlap, camera angle, and what kind of subject you are covering. Now with shiny new toys, these boxes can change, and the arrows can point in totally new directions. The Flight phase influences the Models phase, and therefore what kind of accuracies and quality we can report in the Information phase.
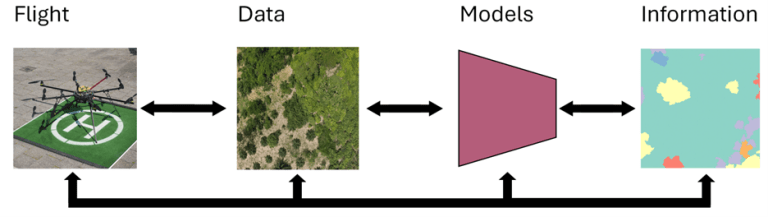
Ideally however, we would like to keep this process as linear as possible: it simplifies the pipeline into a much more understandable and reusable process. Which is also what is happening in many research articles: the methodology covers the data acquisition from the UAV (and perhaps some
other tools) and what kind of model they deployed on the data, and the results sections then presents these results in a linear manner. However, behind the scenes of such published research is often a jumble of back-and-forth arrows, jumping between Information and Data, and then back through the Models, etc.
Now that a basic pipeline is set-up, the following sections examines each phase through pitfalls encountered in UAV projects. These might not all be relevant to every project, but the practical examples are an interesting read, nonetheless.
Flight Phase Pitfalls
Regulatory Preparation Deficiencies
- Inadequate regulatory planning represents one of the most time-consuming and project threatening oversights in UAV operations. While European Union regulations provide relatively harmonized frameworks across member states, local implementation and site-specific requirements demand extensive preparation that many operators underestimate. The regulatory landscape extends far beyond national aviation authorities to include local municipalities, property owners, and neighboring stakeholders.
- On-location stakeholder engagement requires systematic communication with building managers, agricultural landowners, residents, and local authorities who may be affected by flight operations. This process typically involves informing stakeholders about planned flight tracks, dates, times, and safety protocols. What appears as simple notification often requires weeks of coordination, particularly for flights over or near private property, sensitive infrastructure, or populated areas.
- The critical error lies in beginning this process too late in project timelines. Regulatory approval and stakeholder coordination should commence immediately upon project confirmation, not days before planned field operations. Many projects experience significant delays or cancellation due to inadequate regulatory preparation, despite the actual requirements often being straightforward communication and documentation procedures.
Weather-Related Operational Challenges
- Wind conditions represent the primary environmental constraint limiting UAV flight operations and compromising automated flight pattern execution. Standard consumer and prosumer UAVs typically operate safely in wind speeds below 10-15 m/s, but optimal data collection often requires much calmer conditions to maintain precise flight paths, consistent overlap patterns, and stable camera positioning.
- Automated flight pattern limitations become particularly apparent in moderate wind conditions where aircraft drift affects intended coverage patterns and image overlap specifications. GPS-guided waypoint navigation may maintain approximate flight paths, but wind-induced position variations can create gaps in coverage or inconsistent ground sample distances that compromise downstream processing.
- Manual flight operations by skilled pilots can partially mitigate weather-related challenges through real-time adjustments to flight patterns, altitude, and camera positioning. Experienced operators can maintain data quality standards in conditions that would defeat automated systems, though this requires significantly higher pilot skill levels and continuous attention to aircraft positioning.
- Reduced flight time planning becomes essential in challenging weather conditions, as increased power consumption for maintaining position and stability dramatically reduces operational endurance. Projects should incorporate weather contingency planning that accounts for shortened flight durations, potential mission delays, and alternative data collection strategies for adverse conditions.
Spatial Resolution Misalignment
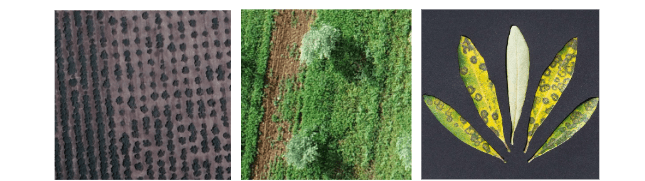
Figure 3. Three levels of detail on olive trees. Left: 30cm Maxar RGB imagery, trees are visible. Middle: 1cm UAV imagery, leaves are visible. Right: <0.1mm diseased olive plant leaf image, disease spots are visible.
- Spatial accuracy too low manifests when your subject of interest is simply not visible from the air, attempting to identify individual plants in a dense forest canopy, or trying to detect small infrastructure defects that require millimeter-level detail from a 50-meter flight altitude.
- Conversely, spatial accuracy too high represents an inefficient use of resources where satellite imagery would suffice – mapping large agricultural fields at 2cm resolution when 30cm would meet analytical needs while covering vastly more area.
- The key is understanding your minimum detectable feature size and working backwards to determine optimal flight parameters. If your subject requires spatial detail beyond what UAV platforms can economically provide, consider terrestrial methods or higher-resolution sensors.
Scale and Coverage Limitations
- Area coverage limitations become apparent when attempting to survey regions that exceed practical UAV flight durations. Most consumer and prosumer UAVs operate effectively for 30-40 minutes per flight, limiting single-mission coverage to roughly 10-100 hectares depending on overlap requirements and flight speed. Projects requiring coverage of thousands of hectares may be better served by satellite platforms, particularly when the required spatial resolution permits coarser sensor configurations.
- This pitfall often emerges during project scoping when enthusiasm for UAV capabilities overshadows practical operational constraints. Always calculate total area coverage requirements against realistic flight parameters before committing to UAV-based solutions. Also taking into account a copter versus fixed-wing approach, with fixed-wing having much longer flight times. Figure 3 presents these scale issues, it is important to understand what size of subject, as well at what scale you want to see this phenomenon. UAVs are not a tool that can both see a complete grove, as well as the individual disease spots on leaves, but fall in between. As the flight times, data acquisition and processing are simply not feasible.
Positional Accuracy Deficiencies
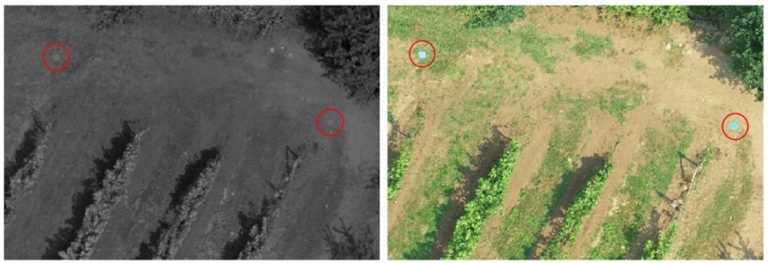
Figure 4. Localizable GCP placed on the ground, visible in the multispectral Blue (left) and RGB imagery (right), with known RTK coordinates.
- Neglecting RTK base stations represents a significant missed opportunity for applications requiring high positional accuracy. Consumer-grade GNSS receivers in most UAVs provide 3-5 meter accuracy, which may be insufficient for change detection, precise mapping, or integration with existing GIS datasets. RTK-enabled systems can achieve centimeter-level accuracy, transforming the precision of derived products.
- Absence of Ground Control Points (GCPs) compounds positioning errors, particularly for temporal studies requiring accurate image registration across multiple flights. Without properly surveyed GCPs, subtle geometric distortions can accumulate, making change detection unreliable and preventing accurate integration with historical datasets. This is especially critical when working without RTK systems, where GCPs serve as the primary mechanism for achieving survey-grade accuracy, see figure 4 for a proper example.
Camera Configuration Errors
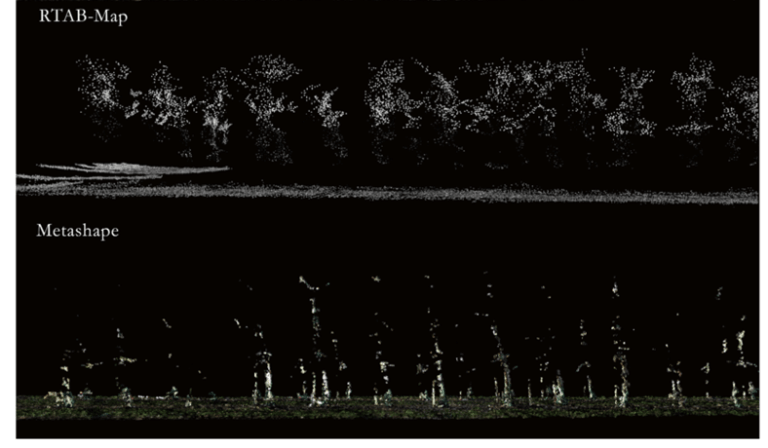
Figure 5. In-row imagery (RTAB-Map), compared to NADIR (Metashape) imagery in an apple orchard. Not the complete lack of features in the canopy area.
- Incorrect camera angles fundamentally compromise specific applications. The most common error involves using nadir (straight-down) imaging for applications requiring 3D crop structure analysis or facade mapping. These applications demand oblique imagery to capture vertical surfaces and structural complexity. Understanding the relationship between camera angle, overlap patterns, and the dimensional characteristic of your subject is essential for collecting appropriate data. In figure 5, this is exemplified by different camera angles capturing different datasets on the same subject.
Radiometric Calibration Oversights
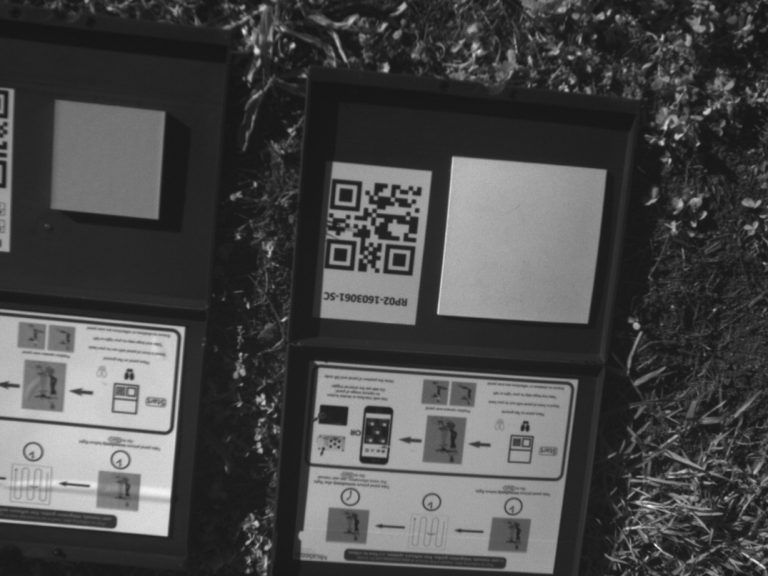
Figure 6. In-field NIR image of a test-reflectance calibration panel, with a single test square, other versions exist, with all calibration squares on the same panel.
- Neglecting reflectance calibration panels during multispectral or hyperspectral flights severely limits the analytical value of collected data. Without proper calibration targets, comparing imagery across different flights, dates, or atmospheric conditions becomes unreliable. This is particularly problematic for vegetation indices, change detection, and any application requiring quantitative spectral analysis.
- Inconsistent camera settings between flights compound calibration problems. Manual exposure settings should be established for each mission based on prevailing lighting conditions, with calibration panels providing reference standards. The one-hour calibration window reflects the rapid changes in solar illumination angle and atmospheric conditions that affect surface reflectance measurements.
- When in need of reflectance values, always bring the panels, measure them for every flight, and systematically process these values in the model’s phase.
Data Phase Pitfalls
Subject Visibility Assessment
- Invisible subjects represent perhaps the most fundamental data quality issue. If your target features are not visible to human interpretation in the collected imagery, they will not be detectable by any algorithmic approach. This includes considering spectral bands beyond visible wavelengths – vegetation stress may be invisible in RGB imagery but clearly apparent in near-infrared bands. The principle applies universally: computational analysis cannot extract information that is not present in the data.
- Before proceeding with complex processing workflows, always perform visual assessment of raw imagery to confirm that your subjects of interest are clearly distinguishable from background features.
Field Data Management
- Poor field organization creates cascading problems throughout the entire workflow. When images are not properly organized during collection, determining which datasets belong to specific flights, dates, or study areas becomes a time-consuming detective process. This is particularly problematic for large projects with multiple flight sessions, where hundreds or thousands of images must be correctly associated with their corresponding metadata.
- Establishing systematic folder structures, naming conventions, and field documentation protocols beforehand prevents these organizational nightmares and ensures efficient processing workflows. A good starting point can be: https://www.linkedin.com/advice/0/what-best-way-manage-drone-data-skills-drones
File Format Inefficiencies
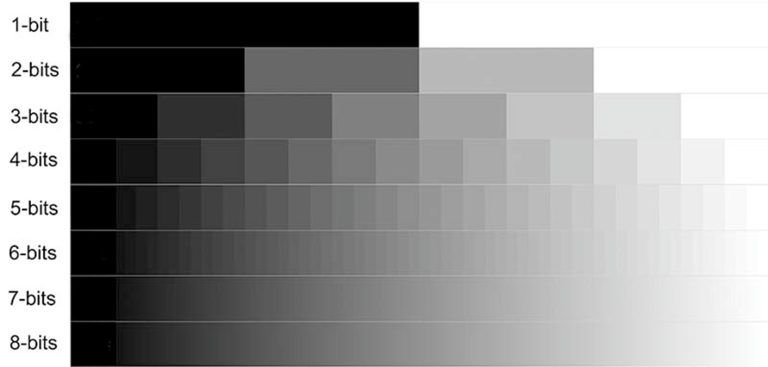
Figure 7. More bit depth is not always useful. When storing two or three parameters, 8-bit might be too much. Figure from: https://www.photoreview.com.au/tips/editing/bit-depth-and-colour-gamut/
- Inappropriate file formats can cripple processing performance and storage efficiency. The most common error involves storing processed orthomosaics as 32-bit floating-point files when the original sensor data is 8-bit or 16-bit. This creates unnecessarily large files that slow processing pipelines without providing additional analytical value. Understanding the bit depth of your sensors and maintaining appropriate data types throughout the processing chain is essential for efficient workflows.
- Conversely, premature data compression can eliminate subtle spectral information needed for advanced analysis. The key is to match file formats to both sensor capabilities and analytical requirements.
Existing Dataset Integration
- Ignoring available datasets represents a significant inefficiency in application development. Before investing in extensive field campaigns, systematically search for existing datasets that might provide training data, validation references, or complementary information.
- Many government agencies, research institutions, and commercial providers offer high-quality datasets that can accelerate application development or provide comparative baselines for your work. A search on Data in Brief, Zenodo, Kaggle, ICAERUS Drone Data Analytics Library can yield promising starting points.
Model Phase Pitfalls
Data-to-model logic
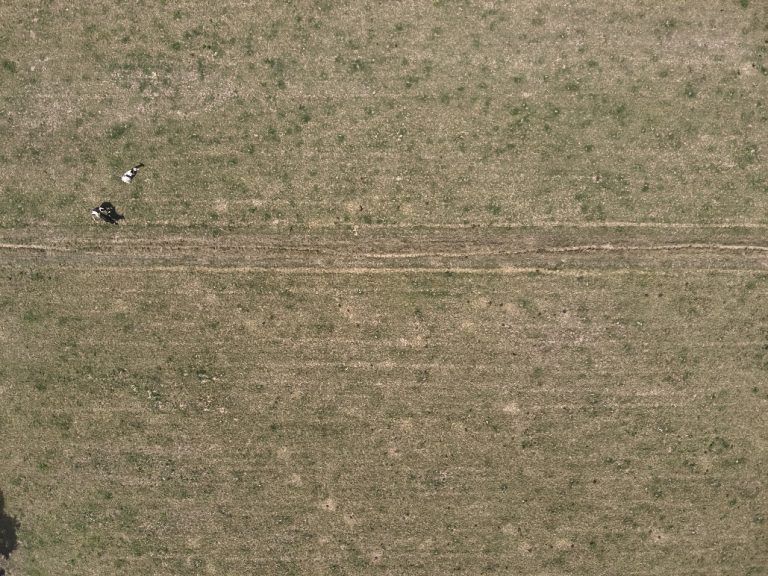
Figure 7. Tiny objects (cows) in 4k imagery: some form of slicing and image reduction should be considered for high-accuracy detection.
- Input file format compatibility represents a critical bridge between data collection and model implementation that fundamentally shapes the entire workflow. Understanding what your chosen model expects as input – and what adaptations are possible on the model side – should inform decisions made during both Flight and Data phases, creating a more logical and efficient processing pipeline. Think about video streams when looking at behavioural dynamics. Perhaps slower timeseries are also important for growth patterns. Or even a single image file or folder is what the model expects.
- Video processing applications benefit significantly from maintaining temporal data structures. Converting video streams to individual frames often destroys temporal relationships that video-based models can exploit for faster, more accurate processing. Real-time applications particularly benefit from this approach, as video models can process continuous streams more efficiently than frame-by-frame analysis of static images.
- Large-scale orthomosaic processing presents fundamental challenges for deep learning applications. Most deep learning frameworks cannot efficiently handle the massive file sizes typical of UAV orthomosaics – often gigabytes of data in single files. The computational memory requirements for processing entire orthomosaics exceed the capabilities of standard GPU configurations, making direct processing impossible.
- Resolution and scaling considerations require strategic decisions about data preparation with UAV imagery. High-resolution orthomosaics or 4K imagery/video may provide excessive detail for many applications, creating unnecessary computational overhead. Reducing image resolution to match model requirements – rather than forcing models to handle unnecessarily large inputs – often improves processing speed without sacrificing analytical performance. Consider that the minimum object size for many Deep Learning applications is around 16×16 pixels.
- Tile-based processing workflows can offer a practical solution for large-scale analysis through systematic slicing, processing, and reconstruction approaches. This involves dividing large orthomosaics into smaller, overlapping tiles that fit within model memory constraints, processing each tile independently, then reconstructing results into seamless outputs. The key challenges involve managing edge-effects, maintaining spatial continuity, and ensuring proper georeferencing throughout the workflow.
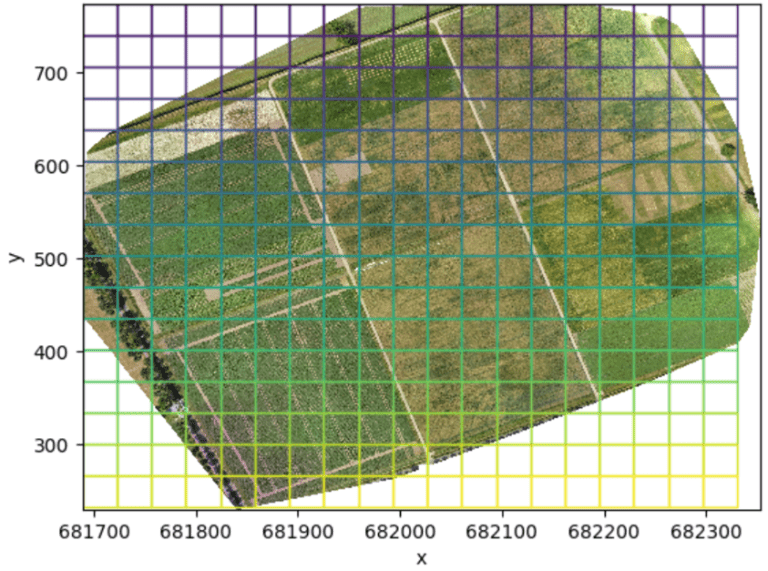
Figure 8. Tiling of a large orthomosaic into smaller (deep learnable) subsets.
Processing Consistency
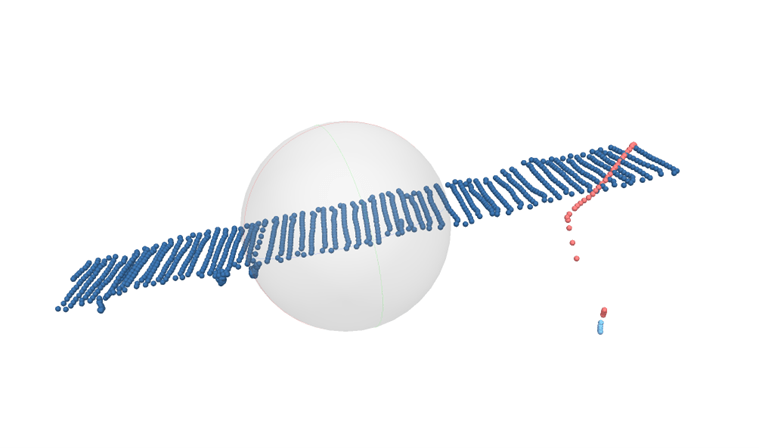
Figure 8. 3D aligned image locations (cameras). Some image locations (red dots) are highly off-axis, compared to the rest of the imagery (blue dots).
- Inconsistent orthomosaic processing occurs when combining imagery from flights at different altitudes, dates, or atmospheric conditions without proper normalization. Variations in ground sample distance, illumination, and atmospheric effects can create artifacts that confound analytical algorithms. Best practice involves processing imagery from individual flights separately, then carefully integrating results with appropriate geometric and radiometric corrections.
Training data challenges
- Insufficient training data represents the most common bottleneck in deep learning applications. Creating high-quality labeled datasets requires significant manual effort, with annotation quality directly impacting model performance. The general principle that more labels yield better results must be balanced against practical time constraints and project budgets.
- For typical UAV applications with limited training data, simpler machine learning approaches can provide competitive performance with significantly reduced computational requirements. Random Forest and Support Vector Machine algorithms can deliver excellent results on the dataset sizes commonly encountered in UAV applications, while offering faster training, better interpretability, and lower computational overhead than deep learning approaches.
- Or choose to embrace unsupervised methods and accept the limitations that these methodologies offer in terms of accuracy when evaluated in a real-world task. These methods can be statistical clustering like t-SNE, K-means, Hierarchical clustering, convolutional autoencoders, etc.
Data Splitting Strategies
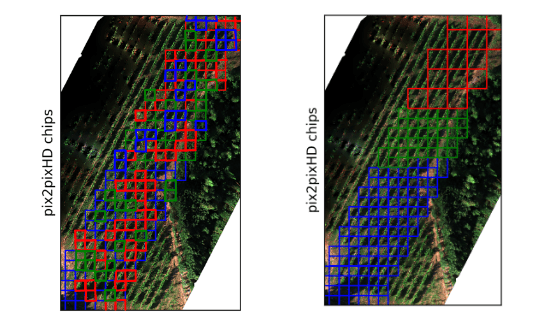
Figure 9. Left: randomized subsets for Train, Test and Validation. Right: spatially separated subsets for Train, Test and Validation.
- Improper train/validation/test splits compromise the reliability of model evaluation. Test splits are often missing. Furthermore, when splits are made: the use of random pixel sampling violates the fundamental assumption of data independence due to spatial autocorrelation in imagery. Nearby pixels are highly correlated, leading to inflated accuracy estimates when training and testing data are spatially intermixed.
- Geographically stratified splits ensure that training and testing data represent truly independent samples by maintaining spatial separation between datasets. This approach provides more realistic accuracy estimates and better reflects real-world model performance.
- No augment on the test split, not needed, and not a good reflection on the real-world performance of the model.
Deep Learning moves too rapidly
- Rapid development in Deep Learning/AI, but it is not that fast to outpace a well-established pipeline. New standards and pipelines are more than just a single model, there are a dozen or so models that work together, AI can be better in a single section but never replaces the whole pipeline.
- Good practices still apply to the new model. Shit in is shit out, good labeling efforts, well balanced datasets, good loss monitoring, etc. will always apply to new models as well as old.
- Many improvements in AI are from huge data and compute resources, whilst very cool developments, UAV analytics exists in a resource-constrained environment and has not that much data. Always be wary of model parameter size (thousands, millions or billions), does it generalize to what I try to do? (input-output fits), is it generative and will it hallucinate?
- Papers tend to overhype, especially non-peer reviewed ArXiV papers with no GitHub page. Understand the graphics that are presented and be wary that the original researchers might over tune their specific model to have good results on benchmarks.
Computational Resource Planning
- Inadequate computational resources can force compromises in model complexity, training data size, or processing timelines that ultimately limit application effectiveness. Understanding the computational requirements of different algorithms and ensuring appropriate hardware availability before beginning model development prevents project delays and suboptimal results. Or deploy/develop clever processing techniques to deal with high-resolution imagery and large model size.
Information Phase Pitfalls
Reporting and Documentation
- Inadequate metric reporting undermines the credibility and utility of research outputs. Simply reporting overall accuracy without providing detailed performance metrics, confidence intervals, or error analysis prevents proper interpretation of results. Different applications require different evaluation metrics – classification accuracy, root mean square error, precision/recall, or spatial accuracy measures – depending on the analytical objectives. Also do not only cover the models, but also preprocessing steps, which often have accuracy assessments too.
- Insufficient transparency particularly affects the growing use of deep learning approaches in remote sensing. Users need to understand what the precise data format inputs are (image, filetype, folder structure, channel order, resolution) and how outputs should be interpreted. This includes providing representative examples of input imagery, intermediate processing steps, and final outputs that demonstrate model behavior across different scenarios.
Reproducibility Requirements
- Inadequate documentation for reproducibility represents a significant limitation in scientific applications. Providing sufficient detail for others to replicate your methodology requires comprehensive documentation of data sources, processing parameters, model architectures, and validation procedures. This includes sharing representative datasets, code repositories, and detailed methodological descriptions that enable independent verification of results.
- The goal is enabling others to achieve similar results using your methodology, which requires transparent reporting of both successes and limitations encountered during application development. The use of public GitHub repositories or other open-source version control is highly recommended when working with codebases. A starting point can be to take a look at the ICAERUS Drone Data Analytics GitHub pages, such as https://github.com/ICAERUS-EU/AgroTwin or https://github.com/jurriandoornbos/RGBtoNDVIconversion
Summary of key points
- Visual first: If humans can’t see the subject in imagery, algorithms won’t detect it.
- Work backwards: Start with required output accuracy and determine necessary flight parameters.
- Maintain linearity: Establish systematic workflows to minimize iterative corrections.
- Resource matching: Align sensor capabilities with analytical requirements.
Critical Success Factors
- Pre-flight planning: Calculate coverage, resolution, and accuracy requirements.
- Field protocols: Systematic data organization and calibration procedures.
- Model selection: Match computational approaches to available data and resources.
- Documentation: Ensure reproducibility and transparency in reporting.
Phase-by-Phase Pitfalls
Phase | Pitfall Category | Specific Issue | Impact | Prevention/Solution |
Flight | Spatial Resolution | Resolution too low | Subjects not visible from air | Calculate minimum detectable feature size, work backwards to determine flight parameters |
Flight | Spatial Resolution | Resolution too high | Inefficient resource use | Use satellite imagery when 30cm resolution suffices instead of 2cm UAV data |
Flight | Scale & Coverage | Area limitations | Coverage exceeds flight duration (30-40 min = 10-100 hectares) | Consider satellite platforms for large areas, choose fixed-wing vs multirotor based on coverage needs |
Flight | Positional Accuracy | No RTK base stations | 3-5m accuracy vs centimeter-level potential | Implement RTK-enabled systems for high-precision applications |
Flight | Positional Accuracy | Missing Ground Control Points | Geometric distortions, poor temporal registration | Use properly surveyed GCPs, especially critical without RTK |
Flight | Camera Configuration | Incorrect angles | Nadir imaging for 3D structure analysis | Use oblique imagery for vertical surfaces and structural complexity |
Flight | Radiometric Calibration | No reflectance panels | Unreliable cross-flight/temporal comparisons | Use calibration panels during multispectral flights, maintain consistent camera settings |
Data | Subject Assessment | Invisible subjects | Features not detectable by algorithms | Perform visual assessment of raw imagery before processing |
Data | Field Management | Poor organization | Difficulty associating images with metadata | Establish systematic folder structures and naming conventions |
Data | File Formats | Inappropriate formats | Storage inefficiency, performance issues | Match file formats to sensor capabilities and analytical requirements |
Data | Integration | Ignoring existing datasets | Missed opportunities for training/validation data | Search for available government, research, and commercial datasets |
Models | Data-Model Logic | Format incompatibility | Workflow inefficiencies | Understand model input expectations during Flight and Data phases |
Models | Data-Model Logic | Large file processing | GPU memory limitations with orthomosaics | Use tile-based processing, reduce resolution to match model requirements |
Models | Data-Model Logic | Resolution scaling | Excessive computational overhead | Consider 16×16 pixel minimum object size for deep learning |
Models | Processing Consistency | Mixed flight conditions | Artifacts from altitude/illumination variations | Process individual flights separately, then integrate with corrections |
Models | Training Data | Insufficient labels | Poor model performance | Balance annotation effort with project constraints, consider simpler ML approaches |
Models | Data Splitting | Random pixel sampling | Inflated accuracy due to spatial autocorrelation | Use geographically stratified splits with spatial separation |
Models | Resources | Inadequate computation | Forced compromises in model complexity | Plan computational requirements before development, consider clever processing techniques |
Information | Reporting | Inadequate metrics | Compromised credibility and interpretation | Report detailed performance metrics, confidence intervals, error analysis |
Information | Documentation | Poor transparency | Unclear data formats and interpretation | Document input formats, processing steps, provide representative examples |
Information | Reproducibility | Insufficient detail | Cannot replicate methodology | Comprehensive documentation of data sources, parameters, code repositories |
